Nobody sends a municipality an invoice for a wildfire. The cost arrives instead as a dozen separate lines across several years and several budgets: overtime, equipment, a road that needs rebuilding, a summer of lost tourism, a slope that has to be replanted and then watched. By the time the total is knowable, nobody is adding it up any more.
That accounting gap is the reason early detection is under-bought. So it is worth doing the arithmetic explicitly, because it is less ambiguous than most public-safety spending.
The bill is decided by size, not by count
The single most useful fact in wildfire economics is that suppression spending is not spread across fires. It is concentrated in a handful of them.
In the US Forest Service record from 1980 to 2002, large fires accounted for 1.4% of ignitions and 93.8% of suppression cost. Every fire under about 120 hectares (the overwhelming majority of everything that started) together consumed 6.2% of the money.
Read that as a budget statement rather than a statistic. A fire service that handles two hundred incidents a season is not spending its money on two hundred incidents. It is spending it on the two or three that got away. Everything else is, financially speaking, rounding.
This has an uncomfortable corollary for how prevention is usually justified. Being modestly faster on every call barely moves the number, because the calls you are already handling well are not where the money is. What moves the number is converting a small set of would-be escapes into ordinary incidents. That is a narrow target, and it is exactly what detection latency governs.
Suppression is the small part of the bill
Even that concentrated suppression figure understates things, because firefighting is the cheap part.
Headwaters Economics puts suppression at roughly 9% of the total cost of a wildfire, with the other ~91% falling on short-term response and long-term damage: evacuation and relief, destroyed property, rehabilitation of the burn, lost revenue, infrastructure repair, health effects, and the multi-year drag on everything that depended on the landscape being there.
Almost none of that lands on the fire service’s budget line. It lands on the municipality, the region, the insurers and the residents. Which is precisely why the decision to invest in detection tends to sit with whoever sees the whole cost (the town hall, the park authority, the utility that owns the corridor) rather than with the crews who carry only the visible tenth of it.
2025 was not an outlier
It is tempting to treat a bad year as weather. The 2025 European season makes that hard to sustain.
- 1,079,538 hectares burned across 25 EU member states: the most destructive season on record, and close to double the 2006–2024 annual average.
- The season started early: over 100,000 hectares had burned by the end of March.
- In early August, a single heatwave produced 22 very large fires in Spain and Portugal that burned 460,585 hectares: 43% of the entire EU total, in a matter of days.
- 39% of the burned area (424,023 hectares) was inside Natura 2000 protected sites.
Look again at that third line. Twenty-two fires, 43% of a record continental total. The concentration pattern from the US cost data reproduced itself at European scale in one week: an overwhelming share of the damage produced by a countable number of events.
Those twenty-two fires each began as one ignition, in one place, at one moment.
Where the hour actually goes
“Detection time” is usually quoted as a single number, but the delay a municipality experiences is a chain, and detection is only its first link:
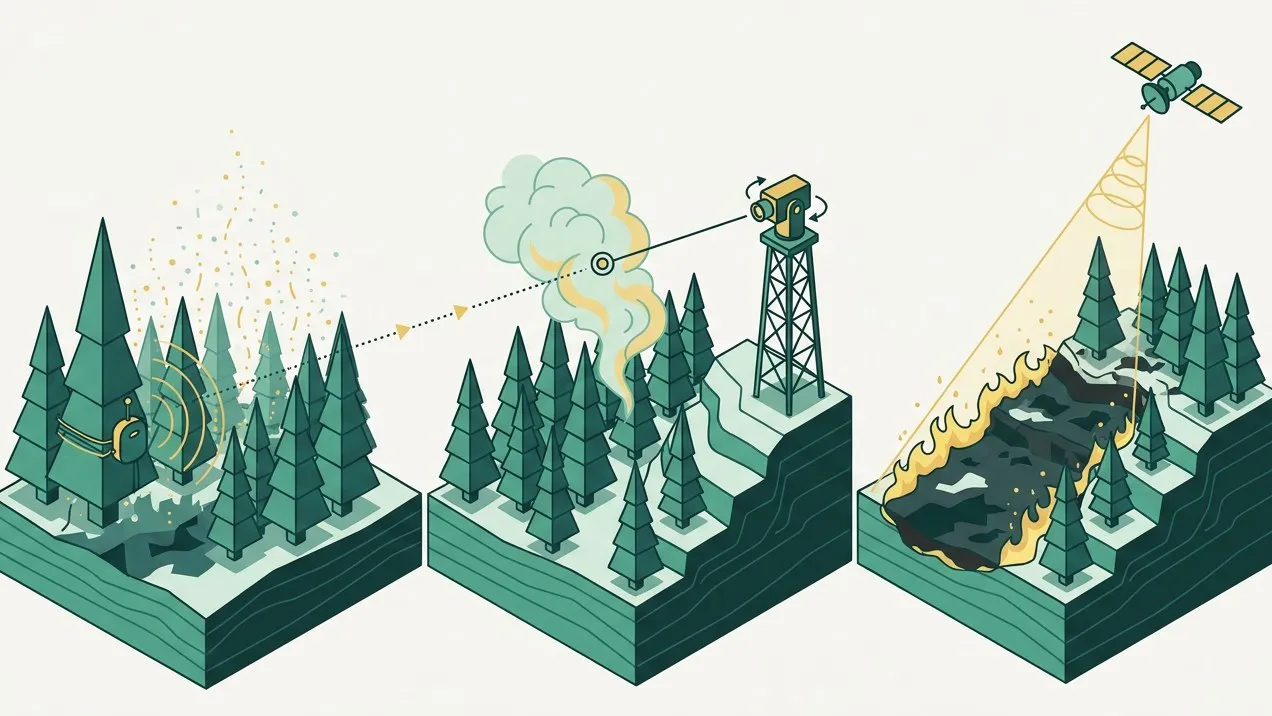
- Ignition → first signal. Governed by what is watching, and whether it can see the spot at all.
- Signal → confirmation. Somebody must establish that the alert is a fire and not a barbecue, a dust plume or a sensor having a bad afternoon.
- Confirmation → decision. A named person with authority commits resources.
- Decision → arrival. Governed by roads, terrain and where the crew happens to be.
Only link 4 is really a function of geography. Links 2 and 3 are procedural, and they are where a surprising amount of the hour goes: an alert with no coordinates, or no way to verify it, sits in a queue while somebody makes phone calls.
This is why we treat alerting as a design problem equal to sensing. An alert that arrives with a location, a confidence level and a way to look at the place before anyone gets in a vehicle removes most of links 2 and 3. An alert that arrives as “something, somewhere in the north sector” does not, however fast the sensor was. The monitoring and alerting layer exists for that reason and not as a dashboard for its own sake.
Sizing it for your own sector
You do not need a supplier’s model to work out whether this is worth it where you are. You need your own incident log and an afternoon.
- Pull ten years of ignitions in your area and split them into fires that stayed small and fires that escaped.
- Characterise the escapes: what hour they started, which sectors, how far from the nearest road, and whether they were visible from any existing lookout.
- Count the blind sectors: areas with no line of sight from a tower, no road access within thirty minutes, or both. These are where detection latency is worst and where it is most expensive.
- Take the worst realistic year rather than the average one, because averages hide exactly the events that dominate the cost, as the 2025 figures show.
- Price the whole event rather than the response: rehabilitation, closed roads, a lost season, replanting. If you only count crew hours you will undercount by roughly an order of magnitude.
What comes out of that is not a return-on-investment percentage. It is a shortlist of sectors where nothing is currently watching and where a fire would be expensive. That shortlist is the honest scope for early detection, and it is usually much smaller than “the whole municipality”, which is good news for whoever has to fund it.
What we can and cannot promise
We are in phase 1: a field test bench, in the Mediterranean, with hardware that may still change. So the honest version of the claim is narrow.
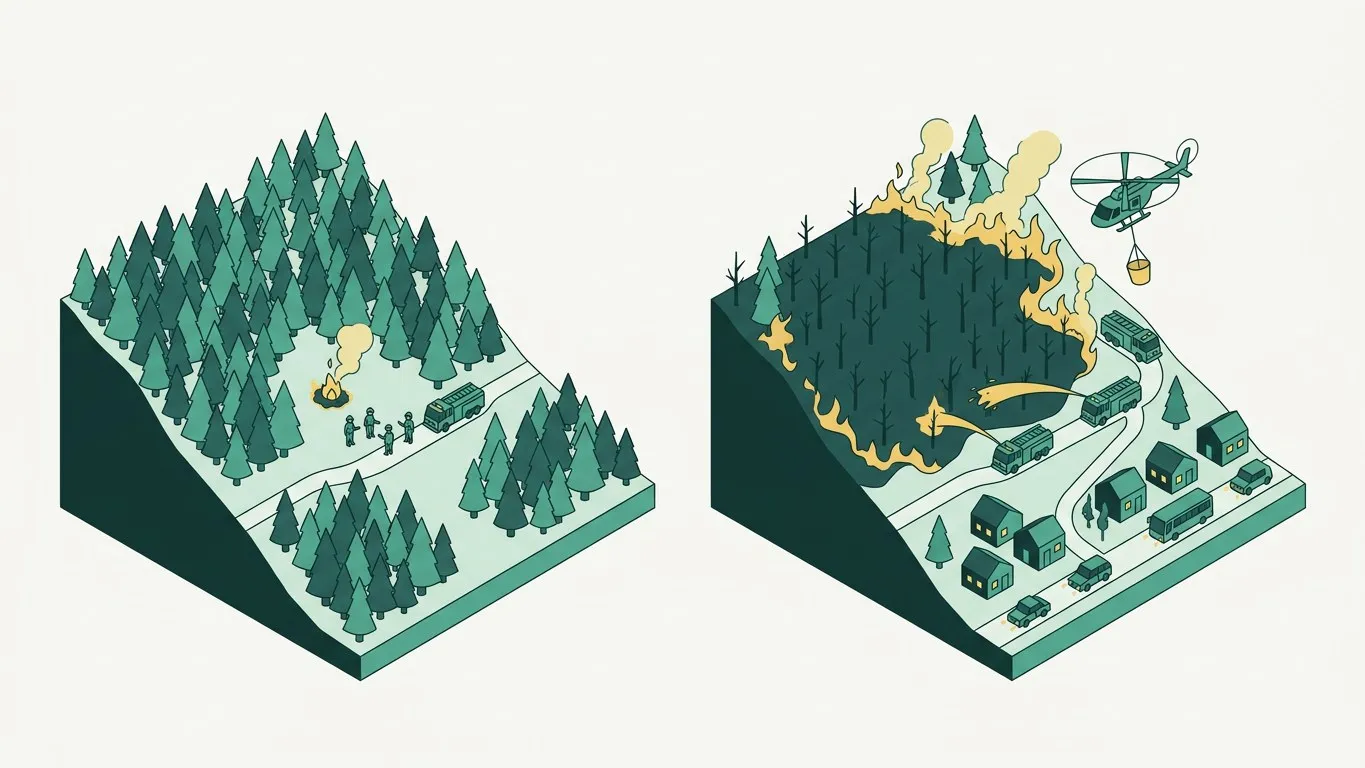
We cannot promise a fire will never escape. Wind, fuel load and slope will sometimes win regardless of when the alarm rings. What early detection changes is the distribution: it moves a portion of would-be large fires into the category where a single crew and a hand tool are enough: the category that, per the record above, costs almost nothing.
Given how the spending concentrates, moving even a few events per decade out of the expensive tail is the whole case. There is no version of this that pays for itself through routine incidents, and we will not pretend otherwise.
If you manage municipal woodland, a power corridor or a natural park and you can already name the sector where nothing is watching, tell us about it. That sector is what a pilot is for.
Sources
- Joint Research Centre, European Commission: 2025 was the EU’s most destructive wildfire season on record
- Copernicus Emergency Management Service: Record-breaking 2025 fire season in the EU
- US Fire Administration: Cost analysis of wildfire suppression activities
- Headwaters Economics: Full community costs of wildfire